Author: Marek Olejnik– Senior Embedded Software Engineer at Blue Chip Technology
1) Introduction
In Part 1 of this blog I developed a wrapper to enable rapid integration of Arduino libraries and examples with Android to run on a BCT Beta HMI.
In Part 2 we look at progressing the simple Arduino example ino into a more sophisticated data logging application and then use it to explore the response of the Winsen MEMS sensors integrated to the Seeed Studio, Grove Multichannel Gas Sensor V2 module.
2) Gas monitor example application
The ported example Arduino application continuously printed the sensor values in the log. While this would be sufficient as a proof of concept that the hardware and software integration was successful, it is a bit crude and a stream of raw sensor numbers doesn’t tell much. A picture is worth of thousand words, so we need an application that can visualise the incoming values in real time, and ideally can plot a chart of the past development as well. This would be the point where a more experienced Android developer would be handy as (s)he would know in and outs of the android UI development and deal with the tricky bits. I brushed off my rusty Java skills and with some help form web sites like stackoverflow.com I discov-ered an excellent free Android library called MPAndroidChart, which has rather extensive functionality and it can do all sorts of chart types and chart animations. For our purpose a simple line chart that can plot values of all 4 sensors should do. Actually we need to display 2 charts on the same screen, one with the short time history and another one displaying the long term overview of the sensor values. Adding the charts on the screen took a bit of fiddling in the Android studio’s UI designer but the final result presents the data in a clear, easy to interpret way.
https://github.com/bluechiptechnology/bctinoapi_demo/tree/main/grove_gas_monitor
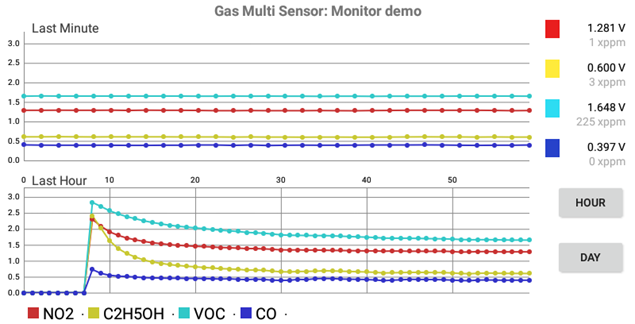
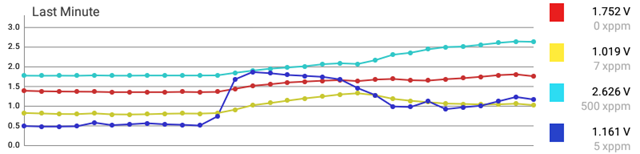
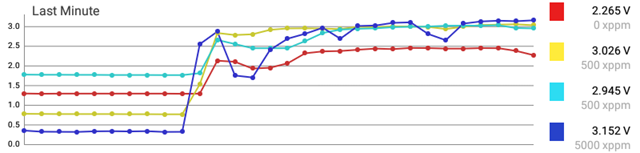
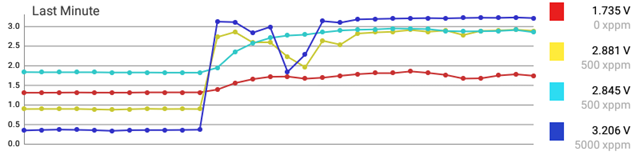
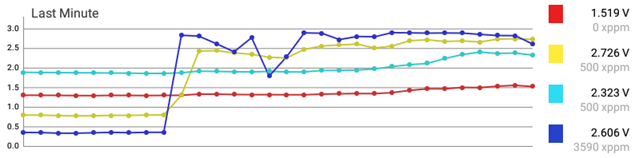
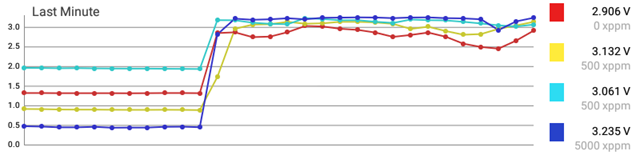
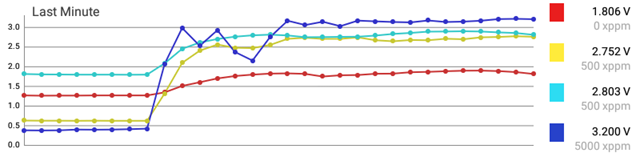
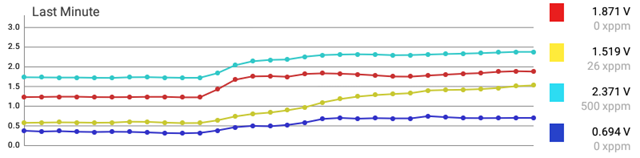
The X axis shows the time (seconds in the top chart, minutes in the bottom chart) and the Y axis shows the voltages of the MEMS sensors as retrieved from the Gas multi sensor Grove module. Both charts are updated every 2 seconds from the data pool that keeps the records worth of 24 hours. The long term chart on the bottom of the screen shows values that are averaged per time unit used, which is either 1 minute when the bottom chart displays the last hour results, or averages of 1 hour period if the bottom chart is switched to 24 hour history. Switching the time scale of the bottom chart can be done by the buttons in the bottom right corner. The top right screen corner shows the actual numbers coming from the sensor. It would not be difficult to expand the functionality to upload the data via Ethernet or Wifi to an IoT service such as AWS or Thingsboard.io if the scope of the project required it.
The above screenshot is a bit boring as the sensor values do not change much if not exposed to the sensed gasses. You can notice that during the first 30 minutes the values of the sensors drop significantly, which is expected because the MEMS sensors need to be heated up. The sensor board has a voltage rail dedicated for sensor heating, derived from the VCC. After the heat-up time the sensors ‘settle’ and produces accurate values. If the sensor was powered off for several days the heat-up time needs to be longer, roughly in the range of a several hours.
The Y axis values on the chart are the voltages produced as a result of using the resistance of the MEMS sensors in voltage dividers. Each sensor has its own voltage divider with a different RL value, see the Grove board schematic on the Seeed studio wiki page for the details. This scaling of all the sensor’s raw values to 0V – 3.3V helps to display them neatly in the same chart.
The gas concentrations are normally measured and expressed in PPM (parts per million), but the maximum PPM of each type of the sensor varies. Therefore displaying the PPM values of all 4 sensors in the same chart would be a bit more tricky as the Y axis value would have to cater all PPM ranges.
Computation of the PPM values out of the raw sensor data representing the input voltages proved to impossible.
The available data sheets for the sensors only provide limited information and a further effort with appropriate laboratory equipment would be required in order to accurately characterise the sensor resistances.
The sensors appear to function correctly, but without further information the PPM calculation can only be guessed – hence my experimental units presented in the demo app.
3) Exposure to different gasses.
Testing of the different chemicals found in a household produced interesting results. Here are some of them. The chemicals were soaked into a new/unused cotton bud and placed 5 mm above the sensors for ~ 30 seconds (except for the soldering fumes measurement). The new/unused cotton bud when measured on its own did not produce any change in any of the sensor voltages. This is in no way a scientific test, but can give a rudimentary picture about the sensor sensitivity in home / office environment.
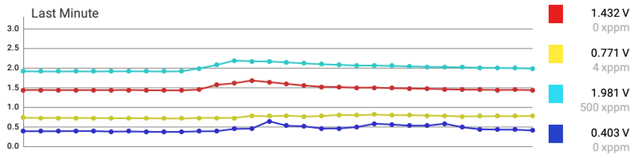
Washing up Liquid
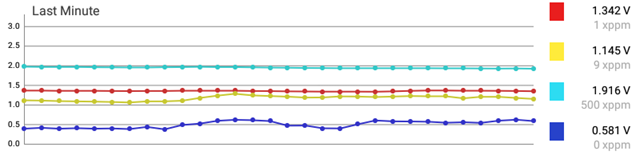
PVA Glue
The above 2 results from the Washing Up liquid and a PVA Glue gave low, yet distinct readings from some of the sensors.
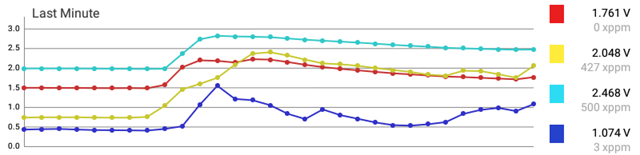
Toothpaste
Antiperspirant
The products that come to contact with human skin – the tooth paste and the antiperspirant – produced surprisingly high values.
SLA Resin
Anti bacterial multi surface cleaner
The 2 liquids above were detected rather slowly compared to other results, but the sensors eventually reported significant levels.
Clear laquer
Bostick glue
Isopropyl alcohol
The above chemicals are pretty nasty stuff, and as expected the sensors had no problem detecting that pretty rapidly.
Insect repellent
Tee Tree oil
Interestingly, the natural oil extract from the tea tree caused the strongest reaction on all of the sensors instantly.
Port wine
The Port wine had the sensor values quite similar to Isopropyl Alcohol.
Soldering fumes
Soldering fumes were measured approx. 5cm away from the sensors.
In all above tests the sensors returned to the initial state within 1 to 2 minutes after the source of the gas was removed from the proximity of the sensors. None of the sensor become ‘stuck’ therefore they could be used for further measurements.
These tests of various chemical substances placed near the sensors proved the Winsen MEMS sensors are capable of sensing some gasses and the Grove gas multi sensor module can be used in specific use cases as it is. Ideally the test should be repeated several times to verify the measured results. Other tests checking the low gas concentrations might be also interesting, but without a more detailed datasheet or precise lab equipment the results cannot be relied upon.
4) Pitfalls and lessons learned
The work on this experimental mini project went smoothly overall. The only hiccup came when I went through the sensors data sheets to calculate the PPM units. I did not expect the lack of documentation for the MEMS sensors used on the Grove module. Some of the information presented in the data sheet graphs seemed to be inconsistent, causing further uncertainty about the sensor’s behaviour. Without proper documentation and without access to a lab equipment that would help me to verify the sensor readings I could not calculate proper PPM values. Lesson learned from this pitfall was to study the data sheets thoroughly before introducing a particular IC into a project. On the other hand the whole experiment did not take much time and the expenses getting the sensor board were low – so no harm done even if the part would turn out to be unsuitable.
Another issue was related to the Grove module itself – the voltage of the 702B sensor measured via multimeter was about 120 to 140 mV lower than what the Grove module was reporting. Such a difference is quite significant considering the whole range is approx. 2V and the scale of the gas concentrations is not expressed in linear way by the sensors. Voltages of the rest of the sensors were OK and matched multimeter readings. This could be a fault in my specific Grove module, or it could be a software issue of the on-board STM MCU that reads the sensor voltages. The source code for the MCU does not seem to be available, so I could not fix the issue quickly. While the STM MCU’s are popular and the code to read ADC values should not be too complicated to rewrite from scratch, it could also be a complete showstopper if the used MCU would be proprietary or unknown. Lesson learned in this case is to evaluate the risks of not having full control over the whole software stack that drives the sensor module.
5) The conclusion and where to go from there.
My experiment to produce a functional prototype by using one of the BCT’s Beta line products along with an off-the-shelf electronic module proved that rapid development and prototyping is indeed possible even with limited resources. The gas monitoring station I put together is far from being a precise measurement tool but shows how existing opensource code and libraries for Arduino could be quickly adapted for a different software ecosystem like Android OS. Such solution runs on several BCT’s Beta products with no code change – the hardware abstraction API ensures the software is compatible with different host boards and different Android OS versions. This gives the project more flexibility in terms of target host board selection and the growth of the product in the future.
With regards to possible improvements of the prototype, I think the station as it is can not be used for any serious gas measurement because of the unknown properties of the selected MEMS sensors. It might be quicker and easier to use completely different brand of sensors where the characterisation data are well known. After that I think the station could benefit from a smaller form factor and a battery power in order to be used in outdoor environments. Having a portable gas monitoring station would allow to measure air quality in remote areas where a bigger system would be inconvenient to use.
About Blue Chip Technology
At Blue Chip Technology (BCT) we specialise in design and manufacture of embedded electronics systems, Hardware, Firmware and Applications. Our typical customer will usually have a proof of concept and will work with Blue Chip to engineer what is often a complex collection of circuit boards into a commercialised solution.
The Beta HMI platform offers an opportunity to develop those prototypes with a validated, field proven integrated SBC, LCD and touch platform, saving several design and development iterations. BCT’s in house manufacturing and commitment to full life cycle support offers a unique proposition to dramatically reduce time to market, approvals and start-up costs.
www.bluechiptechnology.com sales@bluechiptechnology.com